

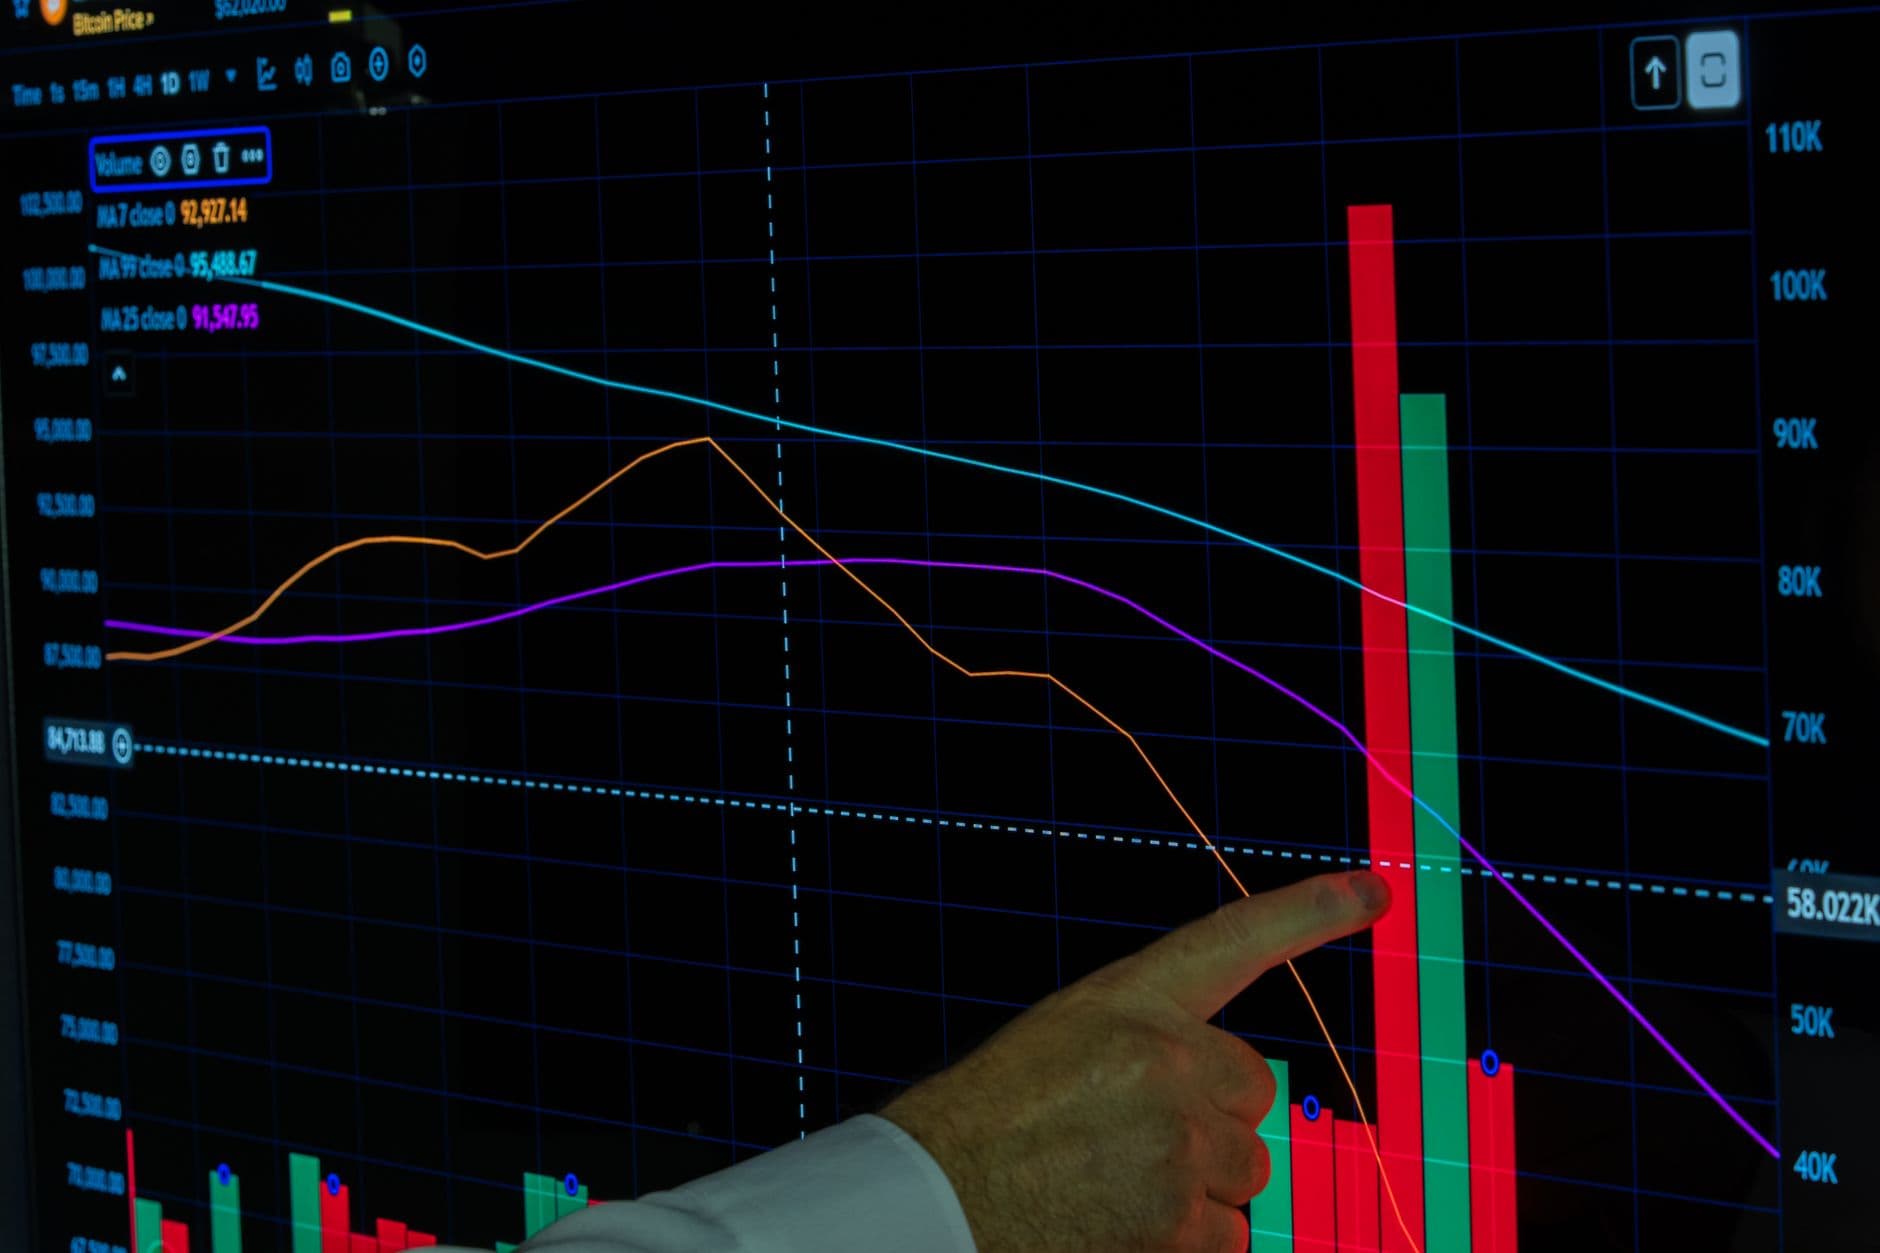
Bitcoin’s overall volatility has declined sharply this year, yet the frequency of unusually large daily price moves has exceeded levels seen during the 2018 bear market, according to a new analysis.
Key Findings from the Analysis
Bitcoin has recorded 10 days in 2026 when its price moved at least three standard deviations from its recent trading pattern. This exceeds the eight such days logged throughout 2018, when the cryptocurrency lost 73% of its value.

Traders define these moves using a 30-day realized volatility measure. The comparison highlights that Bitcoin is experiencing more tail events relative to its recent volatility, even though the magnitude of those moves has shrunk.
Volatility Metrics Compared
Bitcoin’s annualized volatility stands at about 46% year to date in 2026, down from 84% in 2018. The average size of 3-sigma moves has also narrowed to roughly 7%, compared with about 10% eight years ago.

The pattern raises questions for risk models that rely on standard deviation assumptions in an increasingly institutional market.
Broader Context
Bitcoin reached an all-time high near $126,200 in October 2025 before declining to lows around $58,000 by mid-2026. Realized volatility has trended lower amid greater institutional participation and deeper liquidity, yet sudden jumps remain a feature of the market.